Assess performance and measure business outcomes by adding performance metrics to your learning experiences.
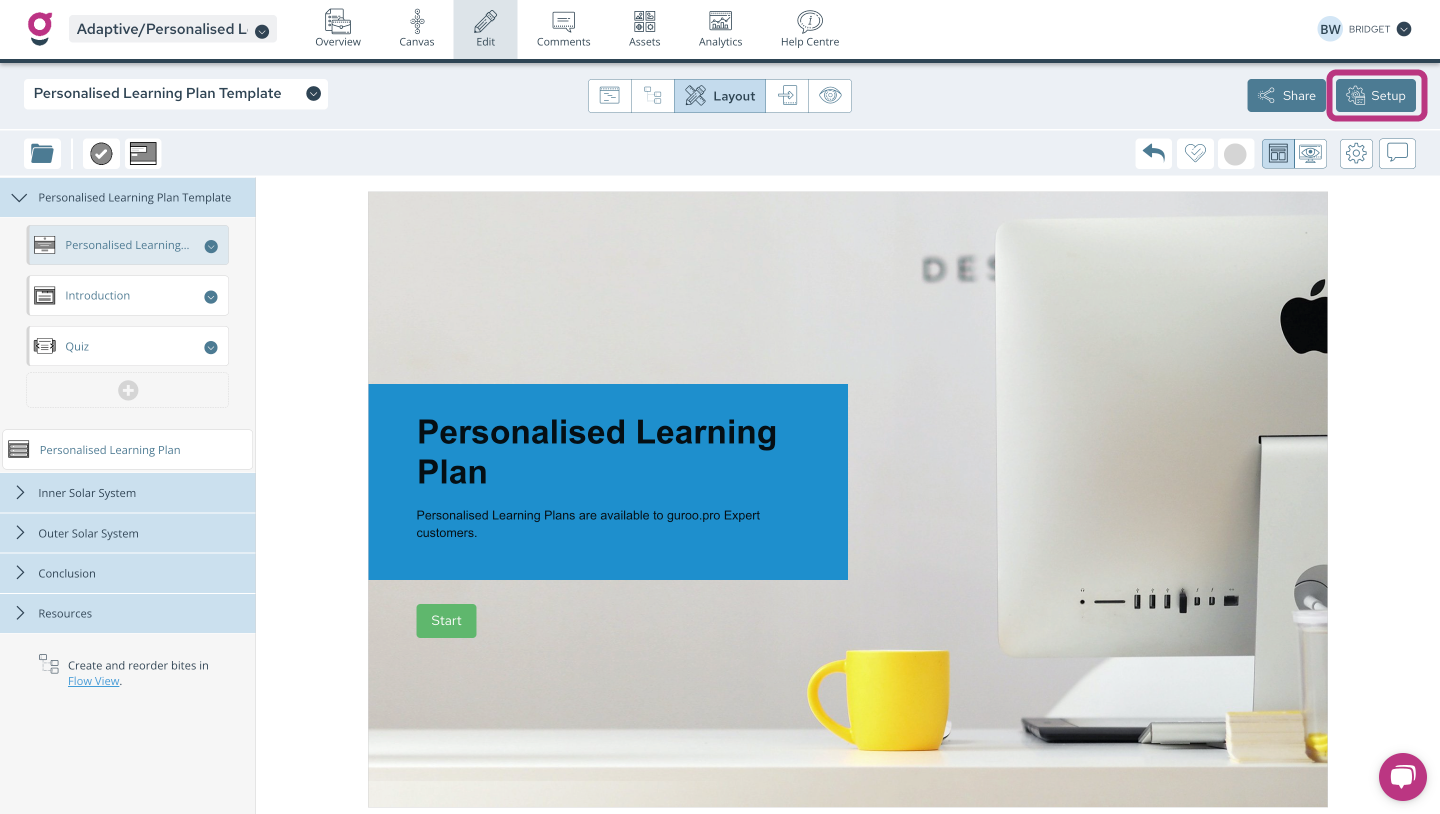
Access the Performance Metrics settings via the Experience Settings:

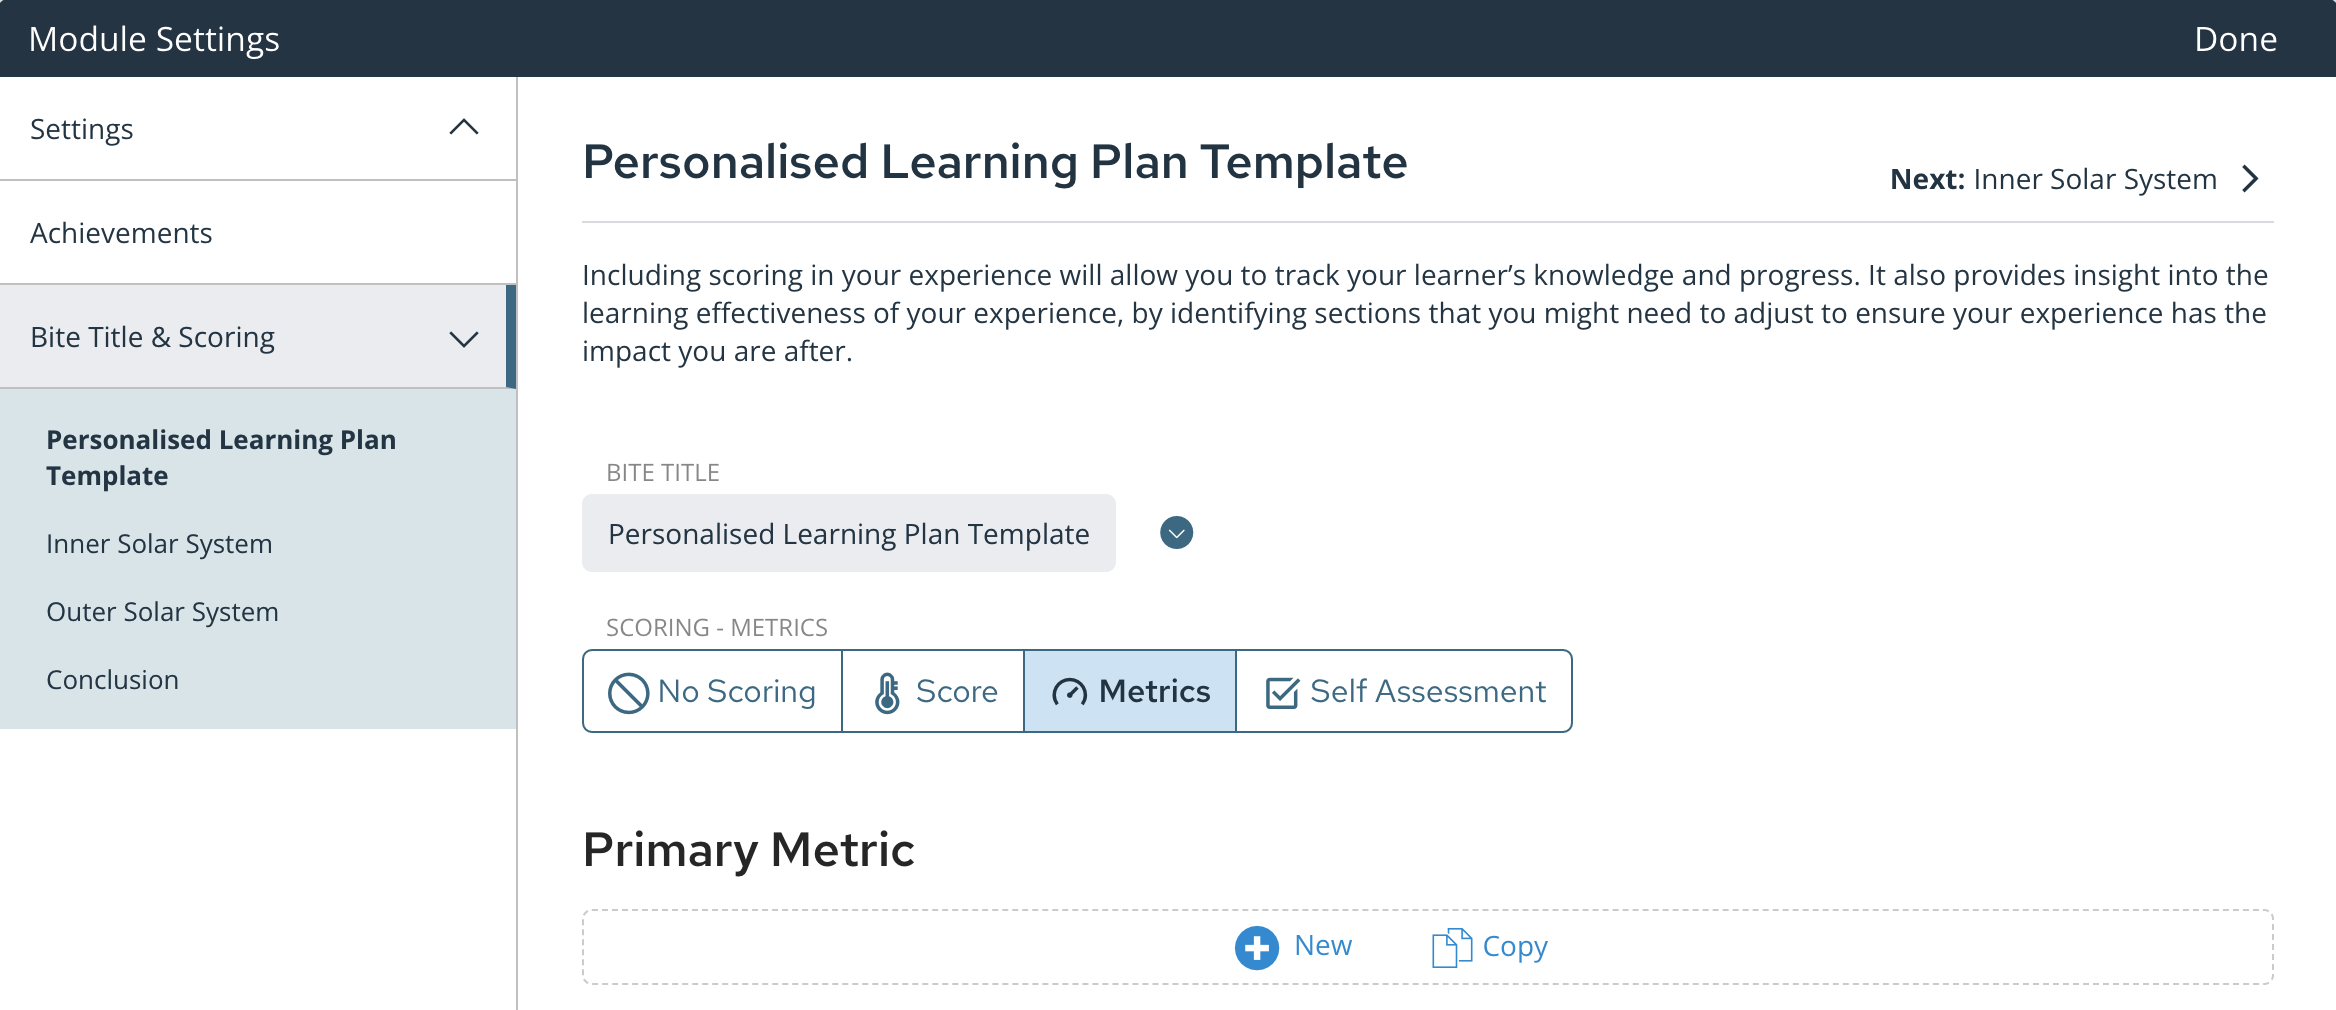
Use the left menu in the Experience Settings to navigate to the Scoring section (or Bite Title and Scoring if your experience has more than one bite).

Choose Metrics and the New buttons to add Primary and Secondary Metrics. You can also copy Metrics from other experiences.
Understanding the Metric Settings
The Primary Metric is the metric that determines the learner's overall score in the experience. The example in the screenshot shows Net Promoter Score as the Primary Metric:
1. Title and Description
Give your metric a title, abbreviated title, and description. This can be as simple as 'Score' but you can also give it a more meaningful title that relates to the content in the experience. As this example is from an experience on Customer Service, we have used 'Net Promoter Score' as the title.
2. Unit of Measurement and Decimal Places
Change the unit of measurement to suit your content. In most cases, you will probably use numbers or percentages, but if you're creating a learning experience about finance, or profit and loss, you might want to change the unit to dollars or euros. You can also choose the number of decimal places you want to display.
3. Weighting and Start Point
When creating questions, you have several different correct and incorrect options. These options correspond to the weighting setting:
In the example above, there are two correct options, but the answer with 2 ticks is better than the answer with 1 tick. Depending on the weighting you have selected in the metrics, the most correct option will earn the learner either 2 points or 3 points.
Similarly, if your preference is for the learner to earn points, but never lose points, use the second weighting option where the incorrect response scores 0 points, and ensure all your incorrect question responses use the 1 cross option.
You can also set the start point for the learner's score. They may start at 0 if they are not able to lose points, or they may start at 50 if they are able to lose points.
4. Outcome
Guroo.Pro uses traffic light colours throughout the learning experience to indicate the outcome of question responses. Use the Outcome settings to determine the range of scores which are considered a fail (red), ok (yellow), or pass (green).
5. Visibility
Use the Visibility toggle to show or hide each metric to the learners.
Secondary Metrics
While the Primary Metric determines the learners overall score, you can also add Secondary Metrics to support scenario learning.
For example, in a business scenario, you may wish to measure multiple metrics like profit, customer satisfaction, and employee satisfaction. When a learner makes a decision to increase their profit margin by using lower quality materials for their product, this may increase profit, but could also decrease customer satisfaction.
Add multiple Secondary Metrics by following the instructions above - the settings for Primary and Secondary Metrics are the same.
Metrics and SCORM
If you are publishing your learning experience as a SCORM 1.2 module, the only score that is communicated to your LMS will be the Primary Metric score. If you are using xAPI to publish your learning experience, then all scores collected using primary and secondary metrics will be communicated to your LRS.


